PVS-Studio for Visual C++
C++Many of our articles are concentrated on anything but the PVS-Studio analyzer itself. We tell our readers about projects we have checked, nuances of C++ language, creation of plugins in C#, running PVS-Studio from the command line… But PVS-Studio was first of all designed for Visual Studio users. We have done a lot to make their work with the tool as comfortable as possible. But this particular fact is very often left outside the frame. I’ve decided to improve the situation and tell you about the PVS-Studio plugin from scratch. If you work in Visual C++, this article is for you.
What Static Code Analysis Is and Why Do We Need It
Static code analysis is the process of detecting errors and defects in software’s source code. Static code analysis can be treated as an automated code review process. Code review is a wonderful technique but it has one big drawback — high cost. You need to regularly gather together several programmers to review new code or re-review old one after applying recommended changes.
On one hand, one would like to do code review regularly. On the other hand, it is too expensive. Static code analysis tools are a compromise solution. They can analyze programs’ source texts without getting tired and provide the programmer with all the necessary recommendations regarding reviewing certain code fragments. Such a program cannot replace a full-fledged team code review of course, but its effectiveness/price ratio makes static analysis quite a helpful technique that is exploited by many companies.
There are numbers of both commercial and free static code analyzers nowadays. A large list of these tools can be found at Wikipedia: List of tools for static code analysis. The list of languages supported by static code analyzers is pretty large as well (C, C++, C#, Java, Ada, Fortran, Perl, Ruby, …). We are, naturally, going to talk about the PVS-Studio analyzer.
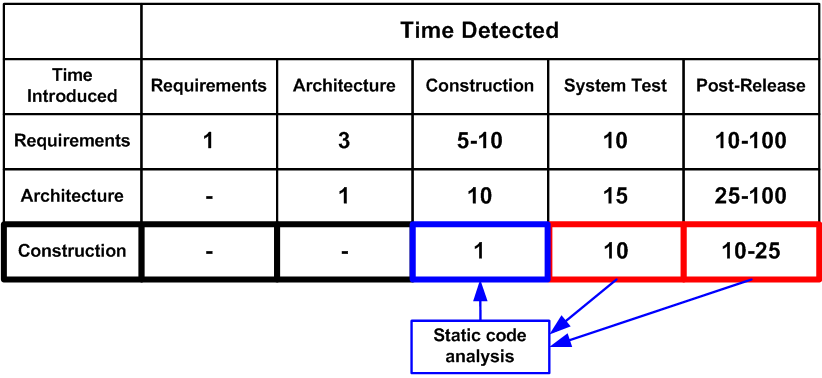
The main advantage about static analysis is that it allows the user to considerably reduce the price of defect elimination. The earlier a bug is found, the cheaper it is to fix. Thus, according to the figures from McConnell’s book «Code Complete», fixing an error at the testing stage is ten times more expensive than at the coding stage:

Figure 1. Average bug fixing price depending on the time the bug appeared in the code and the time it was detected (data for the table are taken from the book «Code Complete» by S. McConnell).
Static analysis tools allow the detection of a large portion of the coding stage errors, which makes the development of the entire project much less expensive. For example, the PVS-Studio static code analyzer can start running in background immediately after compilation and inform the programmer about any potential issues discovered. We’ll talk more about this mode a bit later in this article.
The topic of code review and static analysis is discussed in more detail in the articles mentioned in the References section at the end of this article [1, 2, 3].
PVS-Studio Static Code Analyzer
PVS-Studio is a static analyzer that can detect errors in C and C++ applications’ source code. It also supports C++/CLI and C++/CX language extensions. The analyzer is primarily designed for Visual Studio users. To learn about PVS-Studio Standalone IDE-independent version, see other articles, for example: “Firefox check”. The analyzer smoothly integrates into VS2005 — VS2013. After such integration, a new «PVS-Studio» menu item appears in the IDE’s main menu, and a window to work with diagnostic messages (see Figure 2).

Figure 2. Basic components added by the PVS-Studio analyzer when integrated into Visual Studio. Click on the picture to enlarge it.
Initial Settings
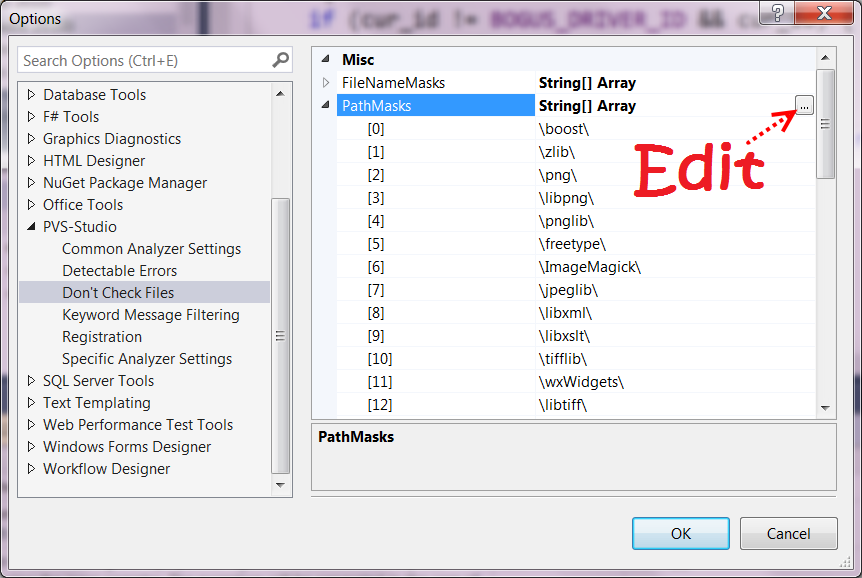
The analyzer is ready for work right after it has been installed. In most cases, you won’t need to set up anything to run your first analysis. The only settings parameter you may need to adjust before proceeding is the exclusion of third-party libraries from analysis. You aren’t going to fix anything in the jpeg library’s source files, are you? Then there’s no need to analyze it. Besides, excluding some folders from analysis will help to reduce analysis time. Folders to be excluded from the analysis can be defined through Options->Dont’t Check Files->PathMasks (see Figure 3).

Figure 3. Editing the list of folders the analyzer shouldn’t check. Click on the picture to enlarge it.
If a file’s full path contains one of the specified names, it won’t be analyzed. By default, the list already contains the names of some folders. However, the ZLib library’s folder in your project may have other name than «zlib» — for example «zip_lib». That’s why you may have to edit this list accordingly. To start editing, click on the button with three dots.
These are examples of valid masks you can use in the PathMasks list:
-
c:\Libs\ — all the project files stored in the specified folder and its subfolders will be excluded from analysis.
-
\Libs\ or *\Libs\* — all the files stored in folder paths which contain the «Libs» subfolder will be excluded from analysis. If no “*” characters are specified, they will be added automatically, so both ways of writing the mask mean the same and are correct.
-
Libs or *Libs* — all the file paths which contain a subfolder named ‘Libs’ or having this text as part of its name will be excluded from analysis. Also, in this case, all the files whose names include the text Libs will be excluded — for example c:\project\mylibs.cpp. To avoid confusion we recommend that you always use slashes.
Besides excluding entire folders, you can specify masks to exclude separate files. For this purpose, the FileNameMasks setting is provided. To learn more about how to work with exclusion lists, see the documentation: Settings: Don’t Check Files.
Project Analysis
Once you are done with the initial settings, you can start analysis of your project. You will most probably want to check the whole solution. To do this, select the menu item ‘PVS-Studio->Check->Solution’ (see Figure 4).

Figure 4. Checking a solution with the PVS-Studio analyzer.
If you have any issues with your first check, visit the “PVS-Studio: Troubleshooting” section at our website for recommendations. These are no silly tips of the «check that the plug is plugged into the socket» style. This section describes typical problems our users contacted us with and offers ways of resolving them.
Working with the List of Diagnostic Messages
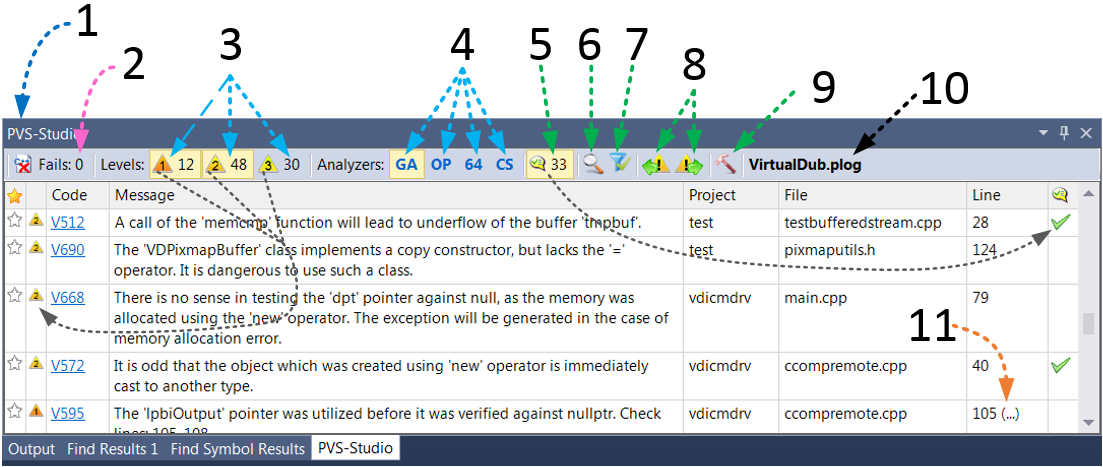
After analysis is finished, all the diagnostic messages will be displayed in a special window. This window has a lot of controls all of which are used to enable or disable displaying of diagnostic messages the user is interested in, according to various criteria. It may seem complicated at first, so let’s examine all the controls in more detail (see Figure 5).

Figure 5. Diagnostic messages window. Click on the picture to enlarge it.
- PVS-Studio’s main window.
- This button turns on «something’s wrong» messages. For example when the tool fails to preprocess one or more files.
- These buttons are used to turn on warnings of different severity levels. In the screenshot, the first two levels are enabled, the window displaying 12 first-level and 48 second-level warnings. The message’s severity level is indicated in one of the columns by a triangle with a number inside.
- Active sets of diagnostic rules. GA stands for general analysis diagnostics, OP for optimizations, 64 for 64-bit diagnostics, CS for user specific diagnostics. In the screenshot, only messages from the GA category are enabled.
- This button is used to turn on/off messages marked as false positives. To learn more about this feature, see the documentation: Suppression of false alarms.
- Search through diagnostic messages.
- Quick filters. You can, for example, set a filter to show only V501 messages and only for the XYZ project.
- Move to the previous/next message. When doing this, the corresponding file is opened and the cursor is set on the line with the potential error. You can also select a diagnostic in the list by double-clicking on it. You can also designate hotkeys to move to the previous/next message. By default, they are Alt+’[’ and Alt+‘]’.
- Open the settings window.
- Displaying the name of a file storing a list of warnings if it was loaded inside output window.
- Some diagnostics suggest examining more than one line of code, in which case an ellipsis is displayed near the line number. Clicking on it shows the list of lines and you can choose among them.
The table with diagnostic messages is divided into several columns:
- Asterisk. It doesn’t have any particular purpose. The users are free to interpret it as they wish. For example, you can use it to mark the most interesting warnings for further, more thorough examination. As an analogy, you can think of using asterisks to mark emails in the email clients Thunderbird or Outlook.
- Severity Level. Severity level a message refers to, the 1-st level including the most suspicious and dangerous warnings and the 3-rd level including messages which are most likely to be false positives or indicate insignificant issues in the code.
- ID. A message’s unique number. It can be helpful when working with a large list. For example, you can jump to a message with a certain number (see the «Navigate to ID…» section in the context menu).
- Code. Message code. Clicking on it opens a page with the message description.
- Message. Message text.
- Project. Project name (you can disable this column through the context menu).
- File. File name.
- Line. Line number. Important! Please note that some line numbers are followed by an ellipsis, for example «123 (…)». Clicking on this number will show the complete list of all the code lines this message refers to. You can also jump to any of the lines in this list.
- «False Alarm» Mark. This mark is used to indicate that a certain message is a false positive. Note that false positives are only shown if button 5 is enabled (see Figure 5).
Sure, it was tiresome to read all this, but I assure you that you will quickly learn how to handle the tool once you have started working with it. You will rarely have ever need to click on any controls to set up something.
Context Menu
So, double-clicking gets you to the relevant code fragment. And right-clicking opens a context menu.
The menu is quite simple and there’s no point in overloading this article with descriptions for each of its items. If you have problems with any of them, refer to the documentation.
However, I’d like to discuss one useful feature in detail.
You remember that you can add folders/files to be excluded from analysis in the settings, don’t you? (see Figure 2). Well, doing this is actually much easier than you may think!
Notice the menu item «Don’t check files and hide all messages from…». Clicking on it opens a drop-down list of paths you can add into the exclusion list (see Figure 6).

Figure 6. Excluding files from analysis. Click on the picture to enlarge it.
You can choose both a single file and one of the folders. In the screenshot, the «E:\[Build]\VirualDub\src\test» folder is selected. It means that all the files in this folder and all of the subfolders will be excluded from analysis. Moreover, all the messages associated with these files will immediately disappear from the list, which is very convenient as you don’t have to re-launch analysis to hide all the messages referring to tests (i.e. the «test» folder).
Incremental Analysis Mode
Introduction into PVS-Studio would be incomplete without talking about one of its most important features — incremental code analysis.
The earlier an issue is found, the cheaper it is to eliminate it. Ideally, it would be great if the tool could highlight errors directly in the program text while it is being written. But implementing it is too difficult and resource-intensive from the technical viewpoint. That’s why PVS-Studio can instead be set to run in background immediately after the edited code has been successfully compiled. Thus, you can set the tool to search for errors in freshly modified code. The running analysis status is indicated by an icon in the system tray.
When an error is found, a pop-up window appears to warn you about the problem (see Figure 7).

Figure 7. Pop-up message warning about suspicious fragments found in recently modified files.
Clicking on this pop-up message will get you to PVS-Studio’s main window (see Figure 2) from where you can examine suspicious code fragments.
Well, it’s much easier for you to try it yourself than for me to write the explanation. You just write code as usual. And if necessary, the analyzer warns you. Do try it!
We ourselves use this mode all the time. Yes, we make mistakes too, and being able to immediately fix them helps us to spend much less time on searching for defects and trying to understand the reason for the program’s strange behavior. It’s a pity to spend 15-20 minutes debugging your code just to find a typo in an index. Here’s one of the most recent examples when PVS-Studio detected an error right after it had been made:
if (in[0] == '\\' && in[1] == '.' && in[1] == '\\')
{
  in += 2;
  continue;
}
But it’s only half of it. In certain cases, PVS-Studio can be much more helpful. Here’s one of our users’ feedback on our analyzer: “A User’s Experience of Working with the Analyzer”. The text does make you wonder, doesn’t it?
To sum it up: Incremental analysis is the feature you obviously ought to try. You will grow to like it once you’ve found a couple of slip-ups in freshly written code.
PVS-Studio’s Functional Capabilities
I’ll be brief. It’s impossible to describe all the diagnostic rules implemented in PVS-Studio in short. For a full list of diagnostics and their detailed descriptions, see the documentation: Error description. In this article, we’ll just do with a table with all the diagnostics grouped into different types. Some of them are included into more than one group. The reason is that this division is pretty relative. For example, some typos may cause use of uninitialized memory. Some other errors, on the contrary, are not presented in the table as they are too specific. Nevertheless, the table will help you get a general understanding of our static code analyzer’s functional capabilities (see Figure 8).

Figure 8. PVS-Studio’s capabilities. Click on the picture to enlarge it.
As you can see, the analyzer is at its best when dealing with bugs caused by typos and Copy-Paste mistakes. It is also good at diagnosing security issues.
To see how it all looks in the real-life projects, welcome to our error database. In this database, we collect all the errors found while checking various open-source projects.
False Positives Suppression
Some portion of messages generated by the analyzer will inevitably be false positives. It can’t be helped. A static analyzer is just a program that doesn’t have an AI and can’t figure out exactly if it has found a genuine error or not.
To eliminate false positives, our analyzer provides a number of different mechanisms. To learn about them in detail, see the following documentation sections:
- Precise Configuration.
- Coarse method allowing you to work with warnings referring only to new or modified code.
Conclusion
Of course, this description of our tool is far from complete. If we are to discuss it in every detail, this article would have turned into a full-blown guide. Our purpose was, however, to show how easy it is for users to work with the analyzer within the Visual Studio environment. To learn about other supported environments and working modes, see the documentation and other articles published at our site. By the way, you will also find there a lot of interesting materials for programmers. Be welcome to study them.
I wish you bugless code and hope that you will like PVS-Studio. If you have any questions, we’ll be glad to help you anytime. Write to us.
References:
- Code review.
- Static code analysis.
- Static code analysis tools.
- Myths about static analysis. The Second Myth — Expert Developers Do Not Make Silly Mistakes.
- Download PVS-Studio and try it in the field.
- Why do I find so few bugs? Leo Tolstoy and Static Code Analysis.
- Negotiate on PVS-Studio license’s price for your team and purchasing options: purchase PVS-Studio.
- A User’s Experience of Working with the Analyzer.
- FAQ for those who have read our articles.
Ropes — Fast Strings

Comments
Sergey Khrenov
Sergey Khrenov
Sergey Khrenov